The Government I lead will be driven, not by the interests of the privileged few, but by yours
Theresa May
The problem
Hospitals are reporting unprecedented pressure on their services and frustration with apparent inability to discharge patients as soon as they have no medical reason to remain in hospital.

Image copyright: Andrew Gentry (Shutterstock)
Insufficient capacity in home care services is cited as one of the reasons for delayed transfers of care from hospitals.
So how big a problem is this?
Delayed transfers due to home care
NHS England publishes monthly data on delayed transfers of care, including reasons given for the delays. The most recent data available on the NHS England website are from September 2016 (1).
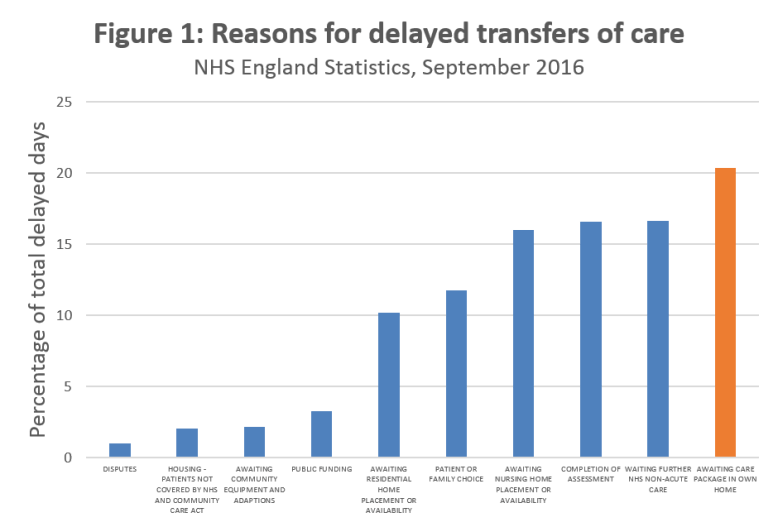
In September 2016, the total number of delayed days transferring people deemed medically fit for discharge out of hospital was 196,246. This is the highest number since records began in August 2010.
Of these, 39,960 days were attributed to delays waiting for a home care package, an average of 20.4 per cent of the total.
Waiting for home care is the number one reason for people being stuck in hospital unnecessarily, closely followed by waits for non-acute NHS services, assessments and nursing home placements (Figure 1).
The averages mask substantial variation across the country.
In September 2016, 57 out of 150 local authority areas reported delayed transfers due to home care above the national average of 20 per cent of total delayed days (Figures 2a and 2b).
These percentage data, however, take no account of wide variations in total number of delayed days and in population size.
So are we comparing like with like?
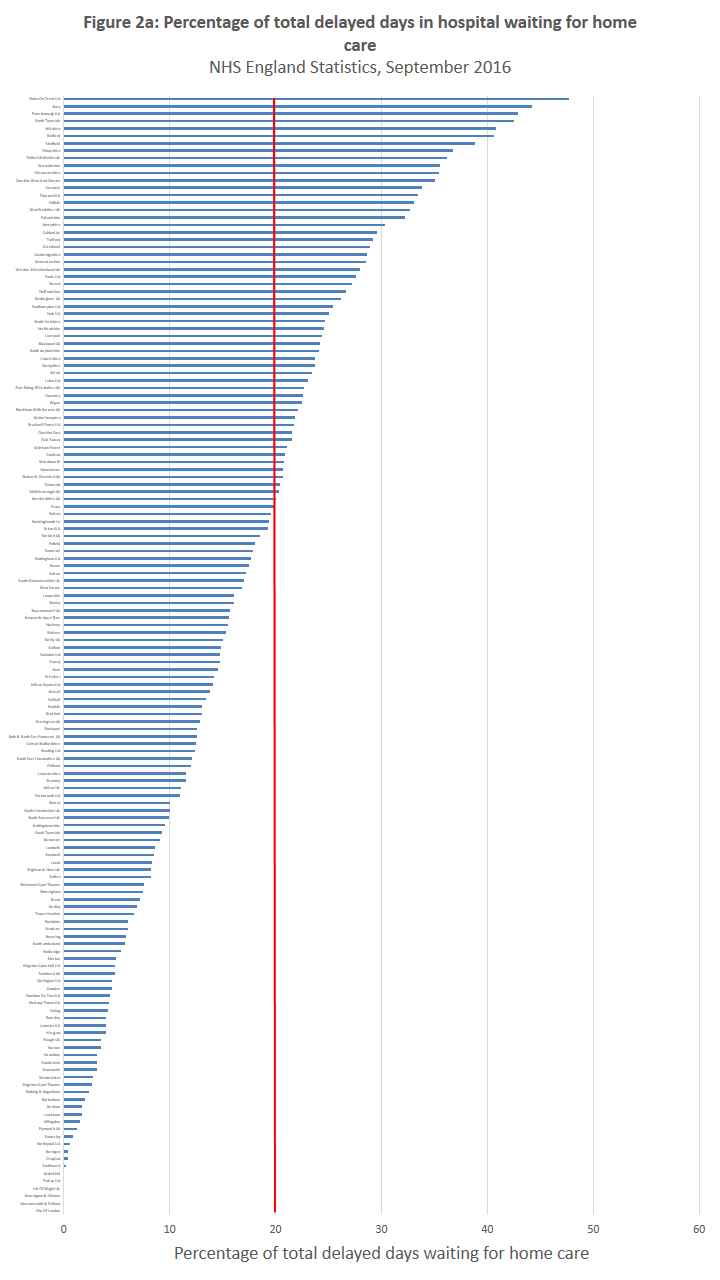
Based on the raw data, Bury, for example, appears second on the list with 44 per cent of delayed days due to waits for home care.
The total number of delayed days in Bury was, however, only 514 compared with 7,542 total delayed days in Hampshire.
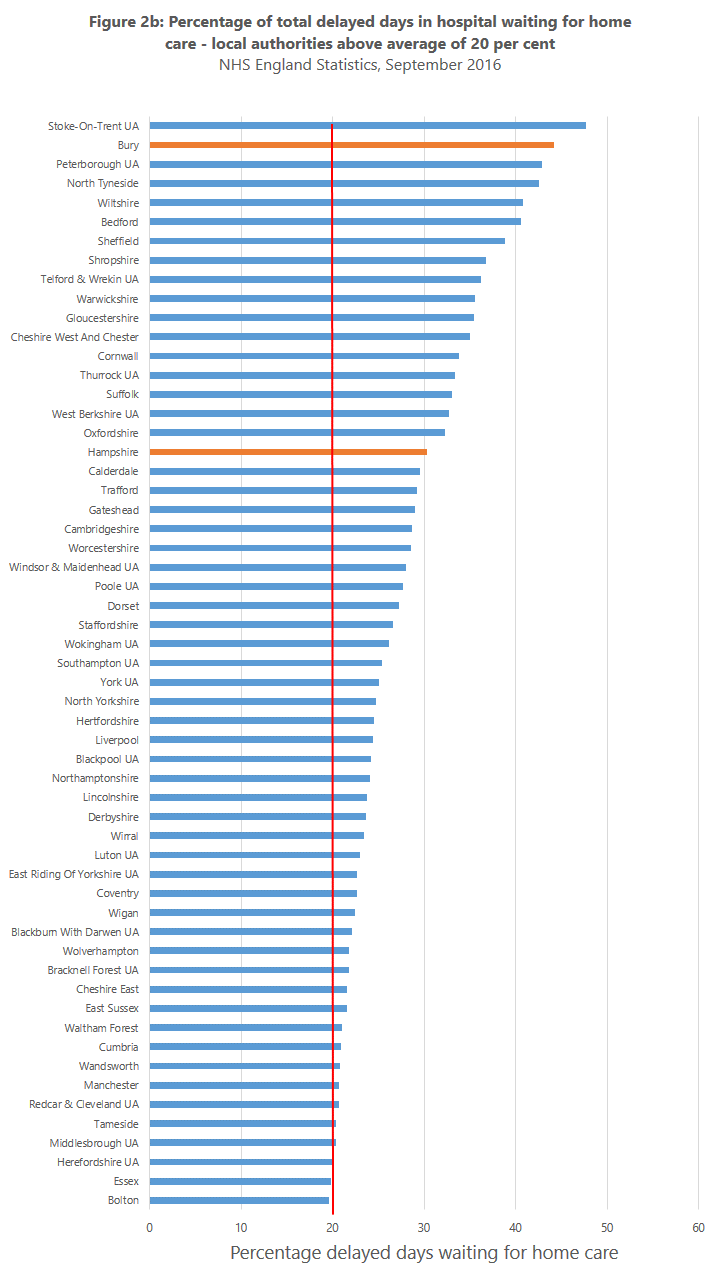
If we plot delayed days due to waits for home care against total delayed days for each local authority area, Bury and Hampshire end up at opposite ends of the graph, reflecting very different total numbers of delayed days (Figure 3).
In general, there appears to be almost a straight line relationship between the total number of delayed transfers of care and the number of delayed days caused by waiting for home care across the country.
This indicates that pressures on the home care market in certain areas are having a significant detrimental effect on delayed discharges and thus on the health and well-being of older and disabled people, who represent the majority of those stuck in acute hospitals unnecessarily.
Research data show that for every 10 days an older person remains in a hospital bed, they lose 10 years of muscle strength and attendant function (2,3).
This frequently results in loss of confidence and emotional well-being, as well as physical well-being, and costs the system as a whole a lot more money.
Hampshire has the highest total number of delayed transfers of care – 7542 days – and, of these, 30 per cent are related to delays waiting for home care.
Bury has a much lower total number of delayed transfers of care – 514 days – but 44 per cent of these are due to delays waiting for home care.
Hampshire, however, is a large county with a population of 1,353,043. It’s therefore unsurprising that it has relatively higher numbers of delayed transfers of care than a much smaller local authority area like Bury, with a population of 187,884.
This begs the question – is the number of delayed transfers proportional to population size?
In June 2016, the Office for National Statistics published estimates of population size in each local authority area (4).
Delayed transfers of care data were thus divided by population estimates to normalise the data.
Interestingly, adjusting for population size results in a different ranking of local authorities from analysis based purely on total delayed days, delayed days due to waits for home care and percentage of total delayed days caused by waits for home care.
The top 20 poorest performing local authority areas for total number of delayed days caused by waits for home care per 100,000 population are shown in Figure 4.
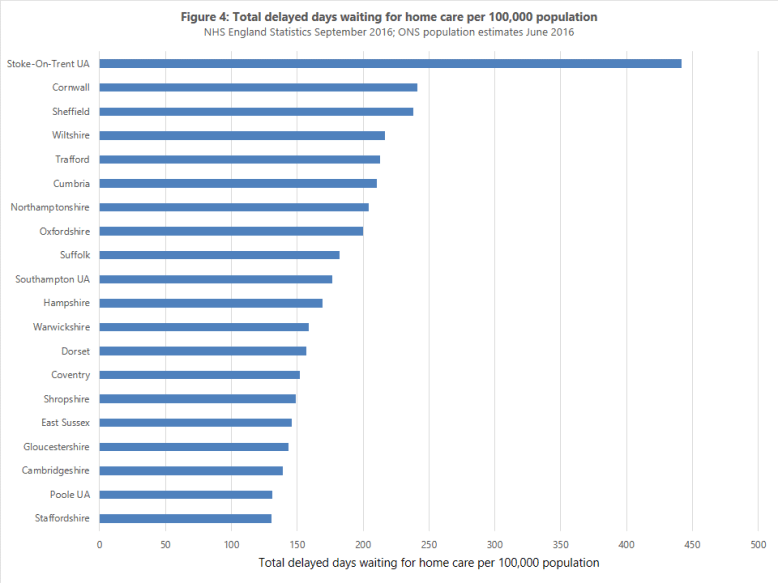
Figure 5 shows delayed days due to waits for home care against total delayed days per 100,000 population for all local authority areas.

As before, an almost straight line relationship is observed between delayed days waiting for home care and total delayed days per 100,000 population, emphasising the vital role of adequate home care capacity for ensuring smooth flow of people through the health and care system.
Hampshire, despite being in 1st place for having the highest total number of delayed days (Figure 3), moves to 17th place when considering total number of delayed days per capita, and 11th place when looking at delayed days due to waits for home care per capita (Figure 4).
Stoke-on-Trent is an outlier because it has a disproportionately high number of total delayed transfers of care for its size of population and, of the total, 48 per cent of delayed days were due to waits for home care.
Stoke-on-Trent City Council has frozen council tax for several years in a row.
Earlier in 2016, Stoke-on-Trent City Council invested an additional £750,000 in an attempt to recruit more home care workers.
Looking at their delayed transfers of care data, this is clearly too little too late.
Across the state-funded home care sector, staff recruitment and retention is a major challenge due to poor terms and conditions of employment and poor working conditions.This has led to insufficient workforce capacity nationally.
United Kingdom Home Care Association (UKHCA) data show an almost 40 per cent turnover of home care staff in England in 2015, predominantly in the lowest paid grades.

Reduction in central government funding for local authorities over the last decade has caused them to squeeze fee rates paid to independent providers, meanwhile provider costs have been rising.
Whilst increases in National Living Wage (NLW) are welcome, they have to be paid for.
If providers are receiving inadequate fee rates from councils to cover costs, they cannot afford to pay higher wages.
UKHCA data suggest that average annual pay to domiciliary care workers fell between 2015 and 2016 in all roles except nurses.

Summary
NHS England data show that a substantial proportion of delayed transfers of care from hospital are due to delays waiting for home care.
Not only does medical evidence show that delayed discharges from hospital cause harm to people’s physical and emotional health, they also place enormous strain on the NHS and cost a fortune.
Delays waiting for home care are caused by inadequate workforce capacity.
Inadequate workforce capacity in home care is caused by poor terms and conditions of employment and poor working conditions, with many councils continuing to commission visits under 30 minutes.
Poor employment terms and conditions for home care workers are due to a cumulative squeeze on fee rates paid to home care providers over a number of years, despite rising costs.
For a number of home care providers operating in the state-funded home care market, the situation has become financially unsustainable and they have decided to hand back contracts and/or exit the market.
Saga wrote the value of Allied Healthcare down to zero on its balance sheet before eventually selling the business to the Aurelius Group.
Care UK sold its home care business to the Mears Group.
Housing 21 and Mitie have both recently announced they will be selling and/or reviewing their home care businesses.
Overall, despite a growing older population and increasing demand for services, spending on social care in the UK will slip back to less than 1 per cent of GDP by the end of the parliament.
The solution
Adequate government funding of home care would be much more cost-effective than pouring yet more money into the NHS to cope with old and disabled people who have no medical reason to be in hospital. It would also likely lead to improved outcomes for the people being cared for.
Home care businesses also provide valuable employment and education for people.
Collectively, social care has 1.5 million workers and contributes more than £20 billion to GDP.
Though central government has permitted local authorities to raise council tax to provide additional money for social care, this is not the right solution.
First, the amount raised by council tax is not enough even to scratch the surface of covering increases in national living wage, never mind demographic pressures and other costs such as pensions and the apprenticeship levy.
Last year in Somerset, for example, increasing council tax generated an extra £3.8m for social care.
In Somerset Care, a not-for-profit provider of adult social care which operates in Somerset and across southern England, the cost of increasing wages of the lowest paid workers by 7.5 per cent in line with the increase in national living wage, and maintaining salary differentials across all pay grades, was £2.5m. Of course, we didn’t receive anything like that amount from the council, who has to spread its budget across a large number of social care providers.
Second, there’s a wide variation in the amount councils across the country are able to raise from council tax.
The amount raised per head of the adult population varies from £5 in Newham and Manchester, to £15 in Richmond on Thames (£10 in the Prime Minister’s Maidenhead constituency).
Tower Hamlets, with a 6 per cent population of people over 65 could raise £160 per old person. In West Somerset, with a 32 per cent population over 65, a 3 per cent increase in council tax would raise only £53 per old person.
This means inequalities are likely to widen.
In addition to enabling councils to raise council tax, the government could bring forward Better Care Fund money ear-marked for social care from 2018/19 to help address the funding gap.
The ‘Improved Better Care Fund’ was additional grant funding, amounting to £100 million a year in 2017–18 and £1.4 billion a year in real-terms by 2019–20. This funding was to be allocated to councils in such a way as to offset differences in their ability to raise their own revenues for social services via council tax.
Third, local councils are unlikely to want to increase council tax due to its likely unpopularity with voters, in the run up to elections in May.
In the longer term, there needs to be a sustainable approach to funding social care, for example, by raising National Insurance or income tax.
Introduction of the Dilnot proposals for reforming care funding, currently consigned to a dusty shelf, would be another option likely to assist the situation.
Given the benefits of good quality home care for promoting independence and improving outcomes for old and disabled people; for reducing pressure on hospitals and cost to the NHS; for providing employment and education opportunities for working age people; and for growing the economy, it makes every sense for the government to address social care funding properly.
References
1. NHS England. Delayed Transfers of Care. September 2016. https://www.england.nhs.uk/statistics/statistical-work-areas/delayed-transfers-of-care/2016-17-data/
2. Gill TM, Allore H, Guo Z. The deleterious effects of bed rest among community-living older persons. The journals of gerontology. Series A, Biological sciences and medical sciences. 2004;59(7):755-761.
3. Kortebein P, Symons TB, Ferrando A, et al. Functional impact of 10 days of bed rest in healthy older adults. The journals of gerontology. Series A, Biological sciences and medical sciences. 2008;63(10):1076-1081.
4. Office for National Statistics. Population estimates for UK, England, Scotland, Wales and Northern Ireland. June 2016. https://www.ons.gov.uk/peoplepopulationandcommunity/populationandmigration/populationestimates/datasets/populationestimatesforukenglandandwalesscotlandandnorthernireland
